Discover the Best Statistics Books to Help You Master Data Analysis
Discover the Best Statistics Books Now!
Are you looking for the best books on statistics? Look no further! At DentalBooks.net, we have a wide selection of books that cover all aspects of statistics. Whether you are a beginner or an experienced statistician, you will find something to suit your needs. Our books range from introductory texts to advanced topics such as data mining and machine learning. We also offer books on statistical software packages such as SPSS, SAS, and R. With our comprehensive selection, you can be sure to find the perfect book to help you understand and apply statistical methods. So don’t wait any longer – explore our collection of statistics books today and start learning! Visit DentalBooks.net now!

Statistics Books
Statistics for Psychology, 7th Edition (Original PDF from Publisher)
Statistics Books


Statistics Books
Statistics Books
Statistics Books
Clinical Informatics Board Review and Self Assessment (EPUB)

Statistics Books
Clinical Informatics Board Review and Self Assessment (Original PDF from Publisher)

Statistics Books
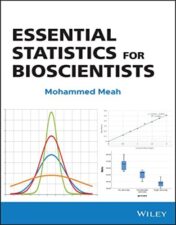
Essential Statistics for Bioscientists (Original PDF from Publisher)
Statistics Books
Regionalized Management of Medicine (Translational Bioinformatics, 17) (Original PDF from Publisher)
Statistics Books

Statistics Books

Statistics Books
Basic Sciences Books
Artificial Intelligence for Innovative Healthcare Informatics (Original PDF from Publisher)
Statistics Books
Statistics Books

Statistics Books
Statistics Books
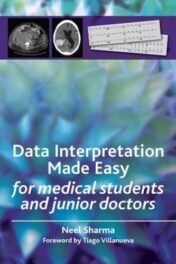
Data Interpretation Made Easy: For Medical Students and Junior Doctors 2013 Original PDF
Statistics Books
Basic Statistics and Epidemiology, 5th Edition 2022 Original PDF
Statistics Books

Statistics Books
Wiley Study Guide for 2021 Part II FRM Exam: Complete Set 2021
Statistics Books
Statistics Books
Statistics Books

Statistics Books
The Statistical Analysis of Doubly Truncated Data: With Applications in R 2021 Original pdf
Statistics Books
Modern Statistical Methods for Health Research 2021 Original pdf
Introduction
Are you looking to become a data analysis expert? If so, then you need to read the best statistics books available. Discover the Best Statistics Books to Help You Master Data Analysis is an essential guide for anyone wanting to learn more about data analysis and how to use it effectively. This guide provides an overview of the top statistics books on the market, including their key features, benefits, and reviews from experts. With this guide, you can easily find the perfect book to help you become a data analysis master.
Introduction to Statistics and Data Analysis
Introduction to Statistics and Data Analysis is a course designed to provide students with an understanding of the fundamentals of statistics and data analysis. This course covers topics such as descriptive statistics, probability distributions, hypothesis testing, linear regression, and more. It is intended to give students a comprehensive overview of the field of statistics and data analysis.
The course begins by introducing students to the basics of descriptive statistics, including measures of central tendency, variability, and correlation. Students will learn how to calculate these measures and interpret them in order to draw meaningful conclusions from data. They will also learn about the different types of graphs used to visualize data, such as bar charts, line graphs, and scatter plots.
Next, the course moves on to probability distributions. Students will learn about the normal distribution, binomial distribution, Poisson distribution, and other important distributions. They will also learn how to use these distributions to calculate probabilities and make predictions.
The course then introduces students to hypothesis testing. Students will learn how to formulate hypotheses, test them using statistical methods, and interpret the results. They will also learn about the different types of tests, such as t-tests, chi-square tests, and ANOVA.
Finally, the course covers linear regression. Students will learn how to fit a linear model to data, interpret the results, and use the model to make predictions. They will also learn about the assumptions underlying linear regression and how to assess the validity of those assumptions.
Overall, Introduction to Statistics and Data Analysis provides students with a comprehensive overview of the field of statistics and data analysis. By the end of the course, students should have a solid understanding of the fundamentals of statistics and data analysis and be able to apply their knowledge to real-world problems.
Exploring Probability and Distributions
Probability and distributions are two important concepts in statistics. Probability is the measure of how likely an event is to occur, while a distribution is a graphical representation of the probability of an event occurring. Together, these two concepts can be used to analyze data and make predictions about future events.
Probability is expressed as a number between 0 and 1, with 0 representing an impossible event and 1 representing a certain event. For example, if you flip a coin, the probability of it landing on heads is 0.5, or 50%. This means that if you flip the coin 100 times, you would expect it to land on heads around 50 times.
Distributions are used to visualize the probability of an event occurring. The most common type of distribution is the normal distribution, which is shaped like a bell curve. This type of distribution is often used to represent the probability of a variable taking on different values. For example, if you were to measure the height of people in a room, the normal distribution could be used to show the probability of each person being a certain height.
Exploring probability and distributions can help us better understand the world around us. By understanding the probability of an event occurring, we can make more informed decisions and better predict the outcomes of our actions. Similarly, by understanding the shape of a distribution, we can gain insight into the underlying patterns of a dataset. With this knowledge, we can make more accurate predictions and draw meaningful conclusions from our data.
Regression Analysis and Modeling
Regression Analysis and Modeling is a powerful tool used in data analysis to identify relationships between variables. It is used to predict the value of one variable based on the values of other variables. Regression analysis can be used to identify trends, make predictions, and analyze the impact of changes in one variable on another.
Regression analysis is a statistical technique that uses a set of independent variables to predict the value of a dependent variable. The independent variables are also known as predictor variables or explanatory variables, while the dependent variable is also known as the response variable or outcome variable. The goal of regression analysis is to find the best fitting line or curve that describes the relationship between the independent and dependent variables.
The most common type of regression analysis is linear regression, which is used to model the relationship between two variables. In linear regression, the dependent variable is assumed to be linearly related to the independent variables. This means that the change in the dependent variable is proportional to the change in the independent variables. Linear regression can be used to identify trends, make predictions, and analyze the impact of changes in one variable on another.
Other types of regression analysis include logistic regression, polynomial regression, and nonlinear regression. Logistic regression is used to model the probability of an event occurring, such as whether a customer will purchase a product. Polynomial regression is used to model the relationship between two or more variables when the relationship is not linear. Nonlinear regression is used to model the relationship between two or more variables when the relationship is not linear and cannot be modeled using linear regression.
Regression analysis and modeling can be used to gain insights into complex relationships between variables. It can help identify trends, make predictions, and analyze the impact of changes in one variable on another. Regression analysis is a powerful tool for data analysis and can be used to gain valuable insights into complex relationships between variables.
Statistical Inference and Hypothesis Testing
Statistical inference and hypothesis testing are two closely related concepts in the field of statistics. Statistical inference is the process of drawing conclusions about a population based on data from a sample. Hypothesis testing is a specific type of statistical inference used to test a claim or hypothesis about a population parameter.
Statistical inference involves making inferences about a population based on data from a sample. This is done by using probability theory and statistical methods to draw conclusions about the population. The goal of statistical inference is to make generalizations about a population based on the data from a sample.
Hypothesis testing is a type of statistical inference used to test a claim or hypothesis about a population parameter. It is used to determine whether the data supports or rejects the claim. In hypothesis testing, a null hypothesis is proposed and then tested against the data. If the data does not support the null hypothesis, then the alternative hypothesis is accepted.
The process of hypothesis testing involves several steps. First, the researcher must state the null and alternative hypotheses. Then, the researcher must select an appropriate test statistic and calculate the value of the test statistic. Next, the researcher must determine the critical value of the test statistic and compare it to the calculated value. Finally, the researcher must make a decision about whether to reject or accept the null hypothesis.
Hypothesis testing is an important tool for making decisions about populations. It allows researchers to draw conclusions about a population based on data from a sample. By using hypothesis testing, researchers can make more informed decisions about populations and draw more accurate conclusions.
Applied Machine Learning and Predictive Analytics
Applied Machine Learning and Predictive Analytics are two of the most powerful tools in modern data science. They are used to make predictions about future events, trends, and behaviors based on past data.
Machine Learning is a branch of Artificial Intelligence (AI) that uses algorithms to learn from data and make decisions without being explicitly programmed. It can be used to identify patterns in data, classify objects, and make predictions. Machine Learning algorithms can be used for a variety of tasks, such as predicting customer churn, detecting fraud, or forecasting stock prices.
Predictive Analytics is the process of using historical data to make predictions about future outcomes. It involves analyzing large amounts of data to identify patterns and trends, and then using those insights to make predictions. Predictive Analytics can be used to predict customer behavior, forecast sales, or anticipate market trends.
Together, Applied Machine Learning and Predictive Analytics provide powerful insights into the future. By leveraging the power of AI and data science, businesses can gain a competitive edge by making informed decisions and anticipating customer needs. With the right tools and techniques, organizations can use these technologies to gain a better understanding of their customers, optimize operations, and improve decision-making.
Conclusion
In conclusion, data analysis is an important skill to have in today's world. With the right statistics books, you can learn how to analyze data and make informed decisions. The books on this list are some of the best resources available to help you master data analysis. Whether you're a beginner or an experienced analyst, these books will provide you with the knowledge and tools you need to become a successful data analyst.